Visual Debugging for Neural Networks: Tools and Techniques
Without proper visualization, neural network training is a black box. Specialized tools let you track metrics, gradients, and activations. Here's which tools to use and how to capture computations directly from the model.
AI-processed from KDnuggets; edited by Hamidun News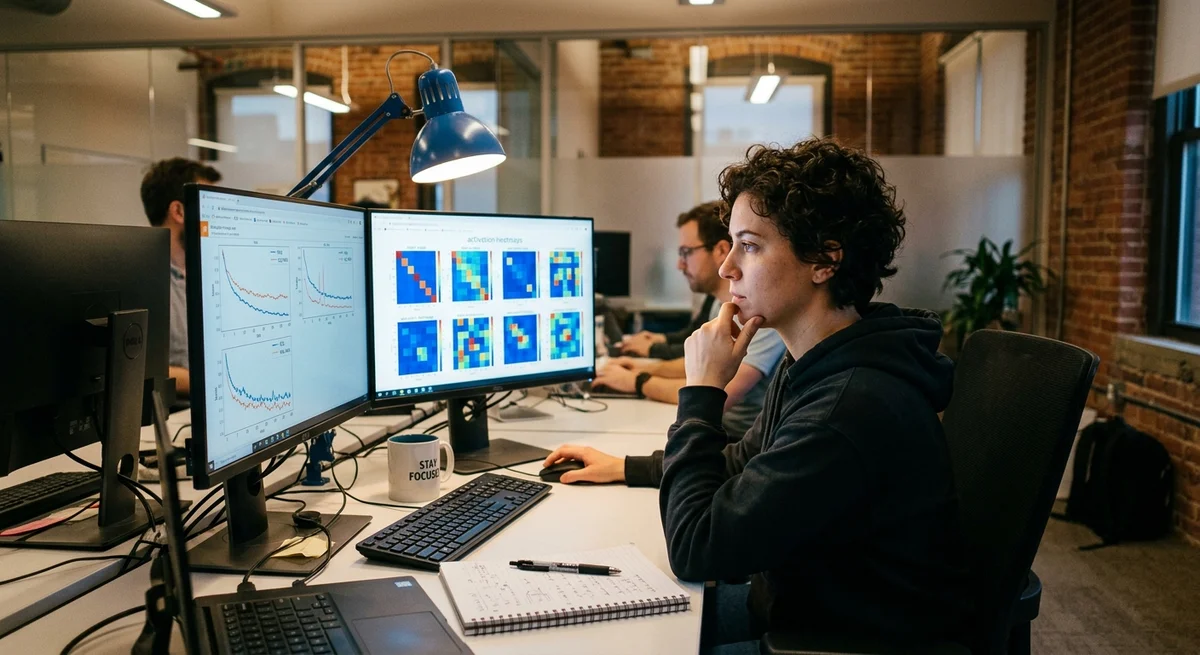
Training a neural network often feels like flying blind: the loss is going down, but why? Where do the errors on the validation set come from? How do you tell what's actually breaking — the architecture, the data, or the learning rate? Without visualization, the only way to find answers is trial and error, and that eats up time. Specialized debugging tools let you look inside the model and see what happens at every stage of training, from gradients to hidden-layer activations.
What to visualize during training
While a neural network trains, it's worth tracking a few key signals so you can catch problems early:
- Loss curves — how loss evolves on the training and validation sets tells you whether the model is overfitting or underfitting
- Gradient distributions — their magnitude and shape point to vanishing gradients or exploding gradients
- Hidden-layer activations — which patterns each neuron learns, and whether any ReLU neurons have died
- Parameter weight distributions — how weights change layer by layer, and whether they're stuck at their initial values
- Confusion matrices and per-class metrics — exactly where the model gets things wrong, and whether its errors are imbalanced
If you don't visualize these signals, you're left in the dark. You can print the final accuracy, but plenty of questions remain that you can only answer by eye.
Visualization tools
In practice, a handful of tools have become standard.
TensorBoard is Google's tool, built into TensorFlow and PyTorch. It draws interactive loss plots and real-time weight histograms, projects high-dimensional data (embeddings) into 2D via t-SNE, and serves everything in the browser at localhost:6006.
Weights & Biases is a cloud service with polished dashboards, built-in experiment comparison (which hyperparameter produced the best result), and artifact tables.
There are other options too: Tensorboard X, Visdom, Neptune, MLflow — the choice depends on scale and budget. For one-off experiments, matplotlib with pandas is often enough.
Capturing computations directly with hooks and profiling
Logging aggregate metrics is only half of debugging. Often you need to look inside individual layers on specific examples.
PyTorch provides hooks for this: you can register a callback that fires on the forward pass (forward hook) or the backward pass (backward hook) through a specific layer. This lets you capture activations, gradients, and neuron outputs on the fly without changing the model's own code.
For step-by-step debugging of PyTorch models, debugpy and pdb work, but they're slow for large batches (you can't inspect 32K examples one at a time).
Profiling (torch.profiler for PyTorch, NVIDIA Nsys for CUDA code) shows exactly where the model loses time: in GPU compute, in data transfers between memory, or in thread synchronization. This is critical for optimizing production models.
Why it matters
Visual debugging turns training from a black box into a transparent, controllable process. Engineers spot problems an hour earlier and experiment 10 times faster. This becomes critical at large organizations, where training a model takes hours or days — a single day lost to stalled debugging costs thousands of rubles.
- Nov 2, 2026Bun creator uses Claude Code to port 750K lines from Zig to Rust in 11 days
- Nov 2, 2026The Verge reviewer builds a $50 Meta Muse Charm alternative with Claude Code
- Nov 1, 202616 models tested on 7 search tools: Exa averaged 10.5 out of 14, SearXNG about 3
- Nov 1, 2026Google's StreamVibe video agent beats other models by 10.7% on response timing and quality
Key Questions Answered
What to visualize during training?
While a neural network trains, it's worth tracking a few key signals so you can catch problems early: Loss curves — how loss evolves on the training and validation sets tells you whether the model is overfitting or underfitting Gradient distributions — their magnitude and shape point to vanishing gradients or exploding gradients Hidden-layer activations — which patterns each neuron learns, and whether any ReLU neurons have died Parameter weight distributions — how weights change layer by layer, and whether they're stuck at their initial values Confusion matrices and per-cla
What are the key details on Visualization tools?
In practice, a handful of tools have become standard. TensorBoard is Google's tool, built into TensorFlow and PyTorch. It draws interactive loss plots and real-time weight histograms, projects high-dimensional data (embeddings) into 2D via t-SNE, and serves everything in the browser at localhost:6006. Weights & Biases is a cloud service with polished dashboards, built-in experiment comparison (which hyperparameter produced the best result), and artifact tables. There are other options too: Tensorboard X, Visdom, Neptune, MLflow — the choice depends on scale and budget. For
What are the key details on Capturing computations directly with hooks and profiling?
Logging aggregate metrics is only half of debugging. Often you need to look inside individual layers on specific examples. PyTorch provides hooks for this: you can register a callback that fires on the forward pass (forward hook) or the backward pass (backward hook) through a specific layer. This lets you capture activations, gradients, and neuron outputs on the fly without changing the model's own code. For step-by-step debugging of PyTorch models, debugpy and pdb work, but they're slow for large batches (you can't inspect 32K examples one at a time). Profiling (torch.prof
Ship AI Faster with Founders, Engineers & Weekly Architecture Reviews
Inside Vibe Club (hamidun.com/club) — weekly live masterminds with Zhemal Khamidun, Tech Radar, full LMS access, and 370+ production Claude Code skills.
The AI world, distilled — once a week
Seven stories that actually mattered, hand-picked. No noise, no reposts, no press releases.
Done! Check your inbox for a confirmation.