Anthropic's Claude Now Generates Charts and Interactive Diagrams Directly in Chat
Anthropic has updated Claude so it can generate charts, diagrams and interactive visualizations right in the middle of a conversation. If the model decides a picture will explain something better than words, it inserts the visual inline. For example, a question about the periodic table turns into a clickable visualization with details on each element. The model decides on its own when a visualization is appropriate. Users do not need to ask for a diagram explicitly.
AI-processed from The Verge; edited by Hamidun News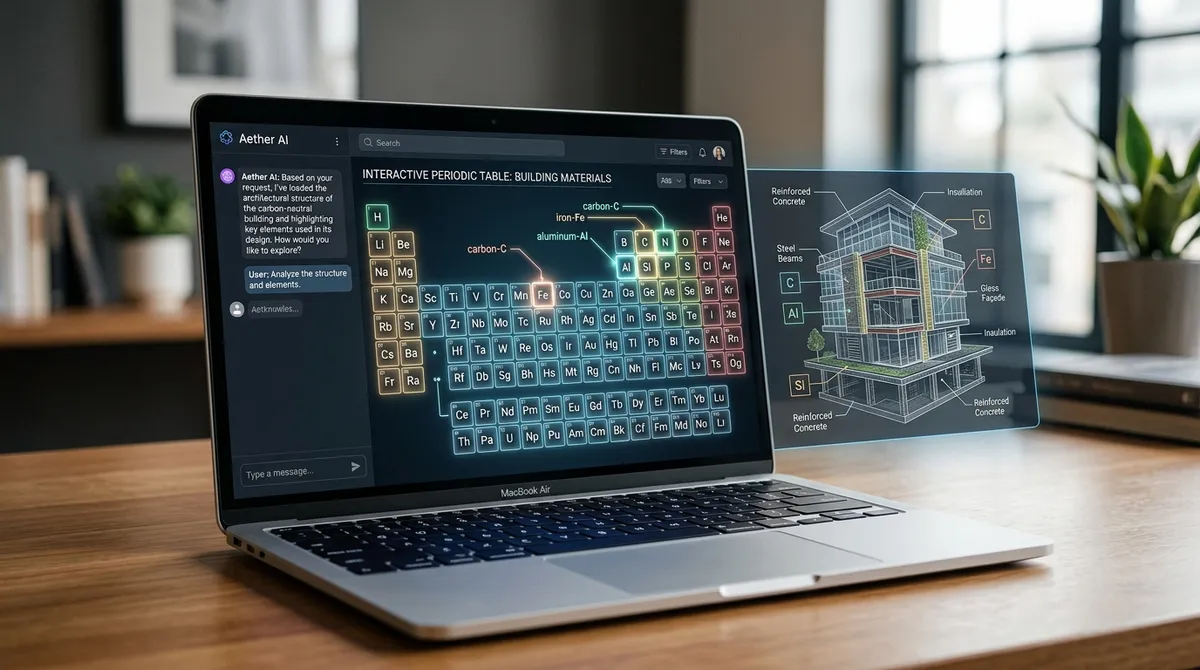
Anthropic has released an update to Claude that changes the familiar text-only format of talking to an AI: the bot can now generate charts, diagrams and interactive visualizations on its own, right inside the dialogue.
Previously, Claude could offer code for building a chart or describe data in text. Now, when the model recognizes that a visual representation of the information will be more useful, it inserts the image inline: not in a side panel, but directly in the flow of the conversation.
The examples Anthropic gives are illustrative. Ask about the periodic table of chemical elements, and Claude builds an interactive table you can click to get detailed information about each element. Ask how load is distributed through a building's load-bearing structures, and the answer is a diagram marking the force paths. This is no longer just a text assistant.
An important detail: visualization is triggered automatically, when Claude itself decides it is appropriate. Users do not need to specifically ask it to "draw a diagram"; the model assesses the context and makes the decision on its own. This approach brings Claude closer to a data analysis tool, rather than just a chatbot.
The feature arrives amid growing competition in the segment: OpenAI and Google are also actively developing the multimodal capabilities of their models. Still, generating interactive elements inline, directly in the chat, is a step that sets Anthropic's update apart.
In practical terms, this means users can get structured visual answers to analytical, educational and technical questions without switching to third-party tools such as Excel or Tableau. This is especially valuable in education, where complex concepts are easier to grasp through diagrams, and in business analysis, where data needs to be seen, not just read about.
Anthropic is steadily expanding Claude's capabilities beyond text. Visualizations are a logical next step toward making the model a full-fledged working tool, rather than just a source of information.
- Nov 2, 2026Bun creator uses Claude Code to port 750K lines from Zig to Rust in 11 days
- Nov 2, 2026mcp-linter finds 18 undescribed parameters in Anthropic's filesystem server
- Nov 2, 2026The Verge reviewer builds a $50 Meta Muse Charm alternative with Claude Code
- Nov 2, 20268 Skills for video in Claude Code: from 244 pixel effects to rough-cut editing
Test Frontier LLMs & Autonomous Agents in One Workspace
Run Claude Opus 5.5, GPT-6, Gemini 3.1, and DeepSeek side-by-side in Nomad AI (nomadnet.ai) — unified model routing, deep research, and multimodal workflows under one subscription.
The AI world, distilled — once a week
Seven stories that actually mattered, hand-picked. No noise, no reposts, no press releases.
Done! Check your inbox for a confirmation.