AWS SageMaker adds full monitoring for LLM models in production
AWS integrated full monitoring for LLM models into SageMaker AI. New Grafana dashboards track GPU utilization, token processing speed, and response quality. Useful in production with popular models: Llama, Mistral, Claude.
AI-processed from AWS Machine Learning Blog; edited by Hamidun News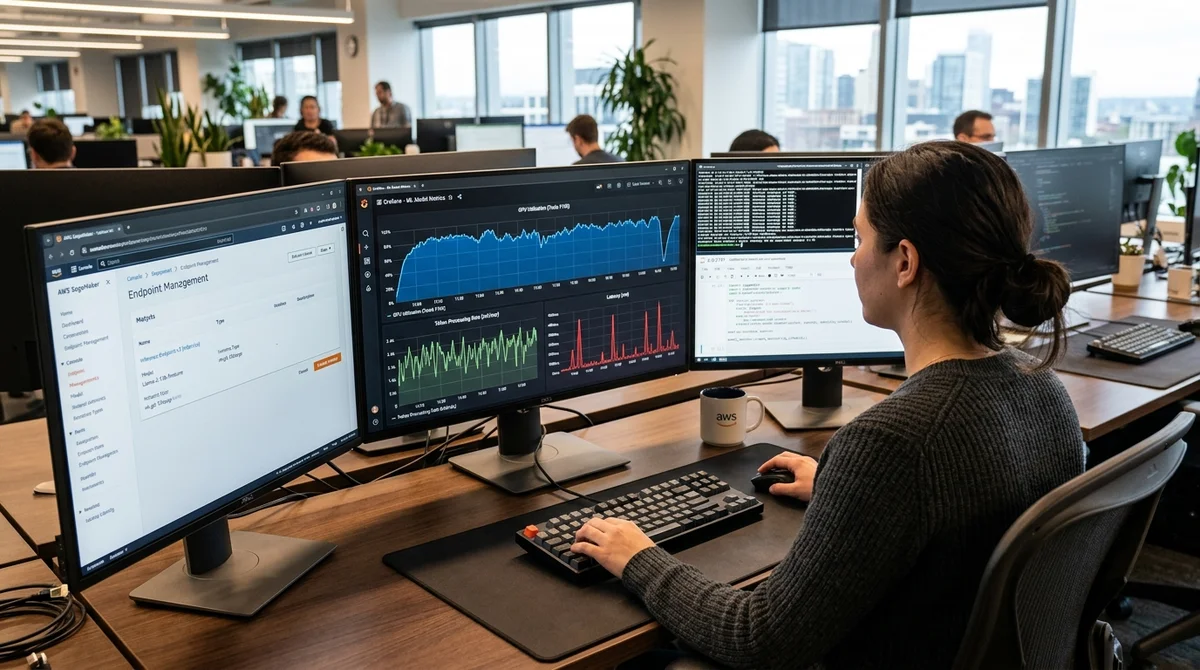
AWS added comprehensive monitoring for LLM models running on the SageMaker AI platform. Using Amazon Managed Grafana, you can now observe both technical metrics (GPU usage, latencies) and quality indicators (answer accuracy, hallucinations).
What's Being Monitored
AWS identified two categories of metrics. The first is resource indicators: GPU utilization, memory usage, and number of tokens processed per second. The second is model quality: response latency, generation accuracy, presence of hallucinations, and alignment with original instructions. New dashboards automatically collect data from SageMaker endpoints and display it in real time. This is important: in production, it's not enough to see "the server is running"—you need to know "the model is answering correctly." Built-in metrics include:
- GPU utilization and memory usage
- Speed of processing incoming and outgoing tokens
- Latency (delay between request and model response)
- Toxicity and hallucinations in output
- Compliance with instructions and compliance metrics
Why This Matters
LLM in production isn't just hardware that's turned on and working. The model might load, the processor might be active, but response quality could be poor. The model can give incorrect answers, be slow, or have learned undesirable behavior. Previously, engineers had to manually integrate logging into Prometheus, ELK, or other monitoring systems. This required time and deep understanding of metrics. Now the tool is built directly into SageMaker. AWS offers ready-made dashboard templates for popular models: Llama, Mistral, Claude, and others. An engineer can deploy monitoring with just a few clicks without writing custom code.
When It's Useful
Comprehensive monitoring is critical when an LLM model serves real users or supports important business processes. Examples: customer support chatbot, AI assistant for document analysis, automatic content generator, assistant for searching a knowledge base. If a model starts generating longer, stranger, or less useful answers, this is visible in metrics before user complaints arrive. Unexpected drop in GPU utilization can indicate problems in request queues or memory exhaustion.
AWS emphasizes that observability is not a temporary solution but a
foundation for reliable LLM production deployment.
What This Means
Monitoring LLM models is gradually becoming standard, just like monitoring conventional web applications. AWS is making it more accessible by embedding ready-made observability tools directly into the SageMaker platform. For engineering teams, this means less time writing custom integration scripts and more focus on the quality of the LLM models themselves. This will accelerate the deployment of AI solutions in production.
Need AI working inside your business — not just in your newsfeed?
I build production AI for companies — custom CRM, internal tools, autonomous agents, workflow automation. Owned by you, shaped to your process, no per-seat tax. Built by Zhemal Khamidun, CPO of AlpinaGPT (AI platform, 6,000+ users).
The AI world, distilled — once a week
Seven stories that actually mattered, hand-picked. No noise, no reposts, no press releases.
Done! Check your inbox for a confirmation.