Interactive map reveals Google's hidden data center strategy
The interactive map shows where data centers are being built in the US and how this affects local resources and politics. It was created by Oregon resident Isab
An Oregon resident named Isabella Rexopuro created an interactive map that shows the actual distribution of data centers in the USA, the pace of their growth, and their impact on local AI policy. The map debunks myths about Google's influence and other tech giants on the use of land and water resources in regions.
Why the Map Was Needed
When Rexopuro heard that Google was actively buying land in Oregon for data center construction, she initially doubted the information's accuracy. "There is a lot of misinformation circulating around data centers," she explains. Google has repeatedly denied land grabs and direct interference in local land use. But the reality turned out to be much more complex than it appeared at first glance.
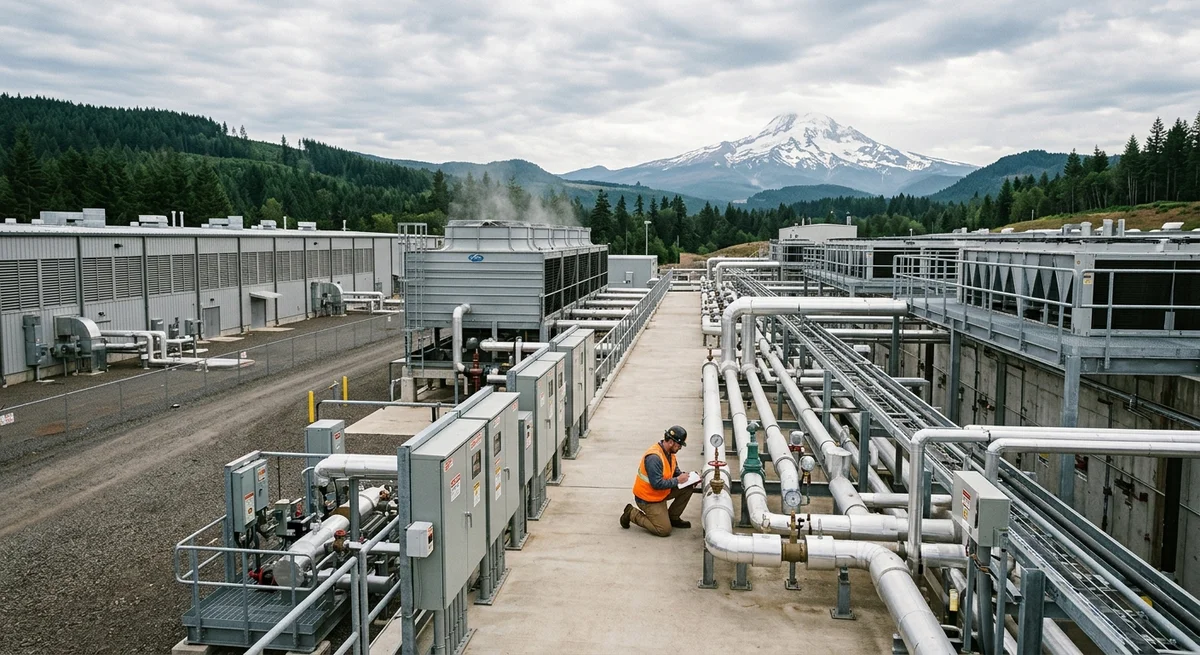
A concrete example: the city of The Dalles, located near the Washington border, attempted to reclaim approximately 150 acres of land from the Mount Hood National Forest. The official reason was purely practical — to meet growing municipal needs as the population grows. However, as Rexopuro explains, the interests behind this decision are far more powerful. "Google is simply a large, anonymous consumer of electricity, and authorities need water to cool the servers," she says. It turns out to be a masked process: the municipality fights for resources ostensibly for the city, but the main beneficiary is the corporation.
How the Interactive Map Works
The map combines several layers of spatial data that are normally stored in different sources:
- Geography of existing data centers and their capacity
- Plans for constructing new facilities in the coming years
- State and city policies regarding AI and regulation
- Availability of water resources for server cooling
- Information on land use conflicts and local initiatives
This multilayered approach makes it possible to see the full picture of interconnections: data centers are necessary for deploying AI models, AI requires enormous computational power, computing requires reliable energy and water, and all this creates a burden on local infrastructure and triggers social conflicts.
Global Race, Local Consequences
The decision of where to build data centers is not simply a matter of corporate business strategy. As the map shows, major tech companies systematically choose regions with the cheapest electricity and maximum available water resources. This makes sense from a profit perspective, but creates serious strain on local water supply and energy systems. In Oregon, Google has already become one of the largest consumers of electricity. Local authorities found themselves in a difficult position: they want to attract investment and high-paying jobs, but are concerned about the environmental and social consequences of such a concentration of resource-intensive infrastructure. Rexopuro's map makes all this tension visible to residents and politicians.
What It Means
Rexopuro's initiative demonstrates how open data and visualization can make complex global trends understandable at the local level. As demand for AI grows exponentially, the question of where to build data centers and what consequences this has for surrounding communities is becoming increasingly political and social.