PaperBanana: Google научила нейросети рисовать графики, за которые не стыдно перед рецензентами
Google и Пекинский университет представили PaperBanana — мультиагентную систему для создания академических иллюстраций. До сих пор LLM неплохо справлялись с тек
AI-processed from MarkTechPost; edited by Hamidun News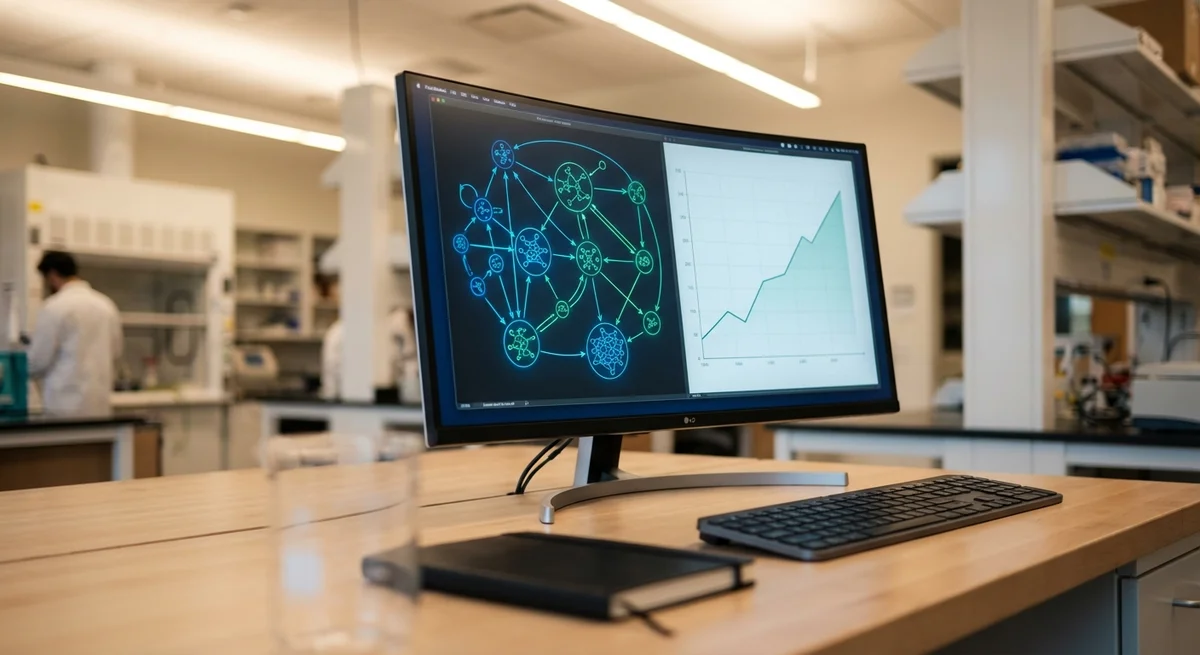
You've ever seen a PhD student cry before a Nature or Science deadline? Usually it happens at three in the morning, when the Matplotlib package once again refuses to align the chart legend, and the methodology diagram in Adobe Illustrator looks like a first-grader's drawing. Until today, the automation of science has gone down the path of text and computation: neural networks have learned to write literature reviews, propose hypotheses, and even code. But visual communication — that very "pretty picture" that explains the essence of a discovery in five seconds — remained purely human labor. Researchers from Google and Peking University decided it was time to change that and presented PaperBanana.
The problem of visualization in science runs deeper than it appears. It's not just a matter of aesthetics. A scientific graph must be accurate, scalable, and meet strict publication standards. Common generative models like DALL-E are useless here — they hallucinate data and don't understand experiment logic. PaperBanana solves this through an agentic approach. Instead of asking one neural network to "draw beautifully," the system distributes tasks among specialized agents. One plans the structure of the diagram, another writes code to render it, and a third critiques the result, checking that axes aren't mixed up and fonts are readable. It's a hierarchical structure that mimics the work of a small design studio inside your laptop.
Why is this important right now? We're on the threshold of an era of "AI scientists." Recent projects like AI Scientist from Sakana AI have shown that a neural network can conduct full-fledged research from idea to paper draft. However, these works still stumbled at the visualization stage. Without quality graphs and clear methodology diagrams, any paper looks unconvincing. PaperBanana is the missing brick in the wall of complete automation of the scientific process. If AI can invent an experiment itself, conduct it, and package it in flawless visual form, the role of humans in producing "standard" science begins to rapidly blur.
The development context is also curious. Google is actively trying to maintain its leadership in tools for developers and scientists amid pressure from OpenAI and Anthropic. Creating specialized frameworks for the academic community is a subtle move. Scientists are a loyal and influential audience. If every other preprint on arXiv contains graphs created with Google tools, this will become the best advertisement for their ecosystem. At the same time, PaperBanana doesn't try to replace a researcher's brain; it replaces their hands, freeing up time for things more important than fighting indentation in LaTeX.
Of course, questions remain about ethics and transparency. If a paper is completely generated by AI, including data visualization, how can reviewers verify the authenticity of that data? A graph in PaperBanana is built on real numbers, but the very ease of its creation could provoke a flood of low-quality, "beautifully packaged" publications. Nevertheless, for honest researchers, this is salvation. The ability to turn raw tables into professional infographics in a couple of minutes — this is the level of productivity one could only dream about before. We're transitioning from the era of "made by hand" to the era of "designed by humans, executed by machines."
The main point: PaperBanana takes the final step toward complete autonomy of scientific research. It remains to be seen whether journals are ready to accept papers where a person was merely the customer, not the executor?
Want to stop reading about AI and start using it?
AI News is a curated feed of AI/tech news. Hamidun Academy teaches you to use AI systematically in your work.